Printable

Kentucky Plant Hardiness Zones with Streams
Data from the 2023 update to the USDA Plant Hardiness Zone Map (PHZM) was used in conjunction with stream location data from the USGS National Hydrologic Dataset (NHD) and USGS 1/3rd ARC second Digital Elevation Models (DEM) to generate a 70° orthographic 3-D rendering of the Plant Hardiness Zones in Kentucky with cultural (county lines) and physical (streams, ridges) markers in the Aerialod renderer.
Format:
16.66" x 6.66" (PDF)
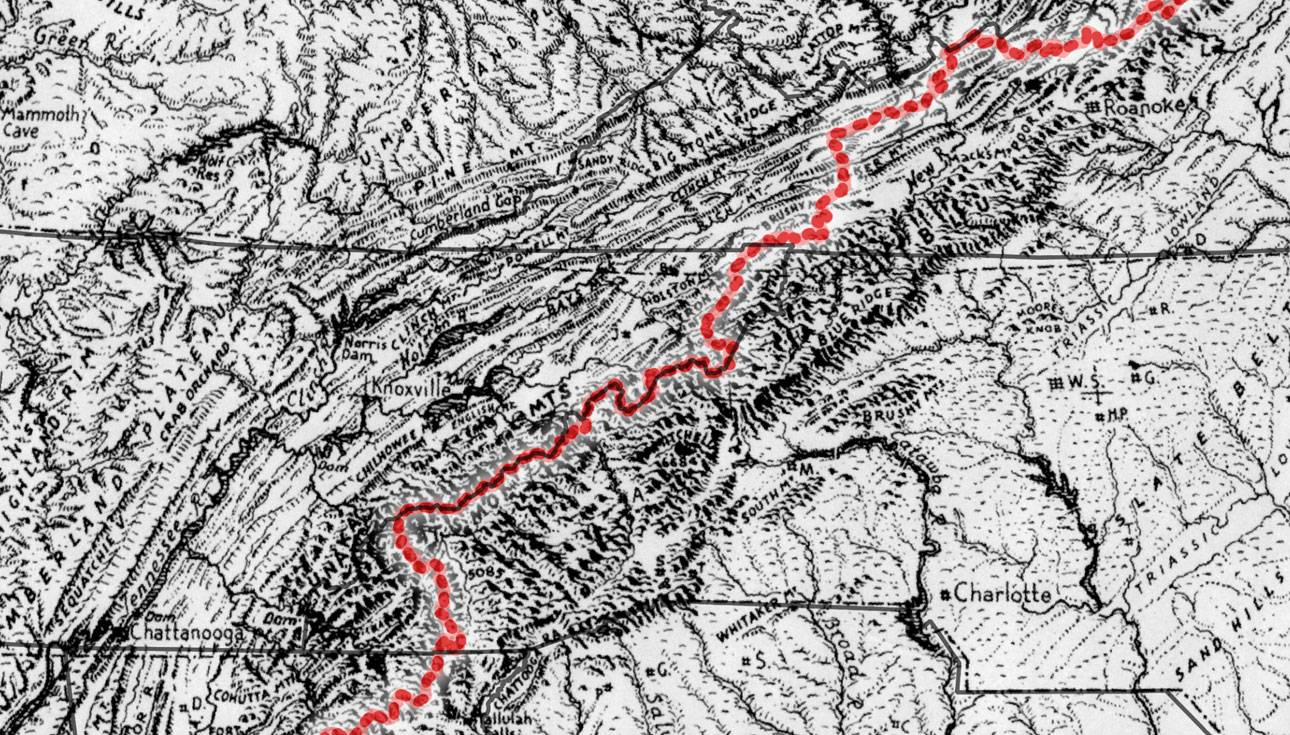
Appalachian Trail in Georgia, Tennessee and North Carolina
Data from the Appalachian Trail Conservancy was used to overlay
a trail marker over the classic, hand drawn map by Erwin Raisz,
which was georeferenced in QGIS (2.14.19-Essen) using the
GDAL Georeferencer.
Format:
11.69" x 8.26" (PDF)

Brewery Density of North America
Using brewery location data from The POI Factory accessed February 6, 2017
and generating 50km hexgrids in QGIS, this map shows the density of breweries across all of North America.
Format:
20" x 15" (PDF)

Major waterways of Kentucky
Data from the National Atlas of the United States, March 2016, 2nd. edition was used to map
water bodies, urbanized areas, and streams classified by Strahler ranking.


 My name is Joshua Knight. I used to be a Senior Extension Associate for the Center for Crop Diversification at the University of Kentucky College of Agriculture, Food and Environment
since 2018. I developed programming, educational resources, and decision support tools as part of the Cooperative Extension Service mission to improve the lives
of the people of the Commonwealth of Kentucky. I left in 2024 after 10 years of public service to the agricultural communities of Kentucky to accept a job offer in the Green Mountains of
Vermont. I keep this portfolio to demonstrate both interactive and static techniques of digital mapping.
My name is Joshua Knight. I used to be a Senior Extension Associate for the Center for Crop Diversification at the University of Kentucky College of Agriculture, Food and Environment
since 2018. I developed programming, educational resources, and decision support tools as part of the Cooperative Extension Service mission to improve the lives
of the people of the Commonwealth of Kentucky. I left in 2024 after 10 years of public service to the agricultural communities of Kentucky to accept a job offer in the Green Mountains of
Vermont. I keep this portfolio to demonstrate both interactive and static techniques of digital mapping.